This note analyzes recent trends in loan growth at domestic bank holding companies (hereafter, banks) and reviews factors related to bank loan growth such as capital and loan write-downs.2 The extension of credit has important implications for the health of the economy.3 For instance, if businesses and households do not have access to credit, they will be unable to make investments that foster economic expansion. Conversely, unsustainable growth in credit, which could be spurred by inadequate lending policies that fail to account for borrowers’ ability to repay, can lead to increased risk for individual firms and for borrowers that face financial distress and its adverse consequences. In addition, if financial firms fund risky loans with insufficient capital to withstand resulting losses, the financial sector is vulnerable to adverse shocks.
Banks are an important source of credit to households and businesses. In the past three years, overall bank lending has been robust. Between December 2013 and December 2016, bank credit increased by more than 20 percent, roughly double the 11 percent increase for nominal gross domestic product (GDP).4 However, recent lending growth by large banks has been slower than growth at other banks. This difference in trends across large and small banks is consistent with such things as differing financial crisis experiences, regulations designed to make large banks more resilient to adverse shocks, and a reduction in the perception of too-big-to-fail (TBTF). Large banks had different financial crisis experiences from most smaller banks, and this experience may have shaped their post-crisis business strategy. In particular, large bank balance sheets were especially vulnerable due to high leverage, fragile liquidity structures, and large loan losses. Regulations such as supervisory stress tests, the liquidity coverage ratio, and extra capital requirements are only mandated for large banks. At the same time, a reduction in the perception of implicit government support for the largest banks would generally lessen any related funding advantage that large banks have over smaller banks. Overall, it is difficult to isolate the effect of any specific driver of the differing loan growth rates using the available data.
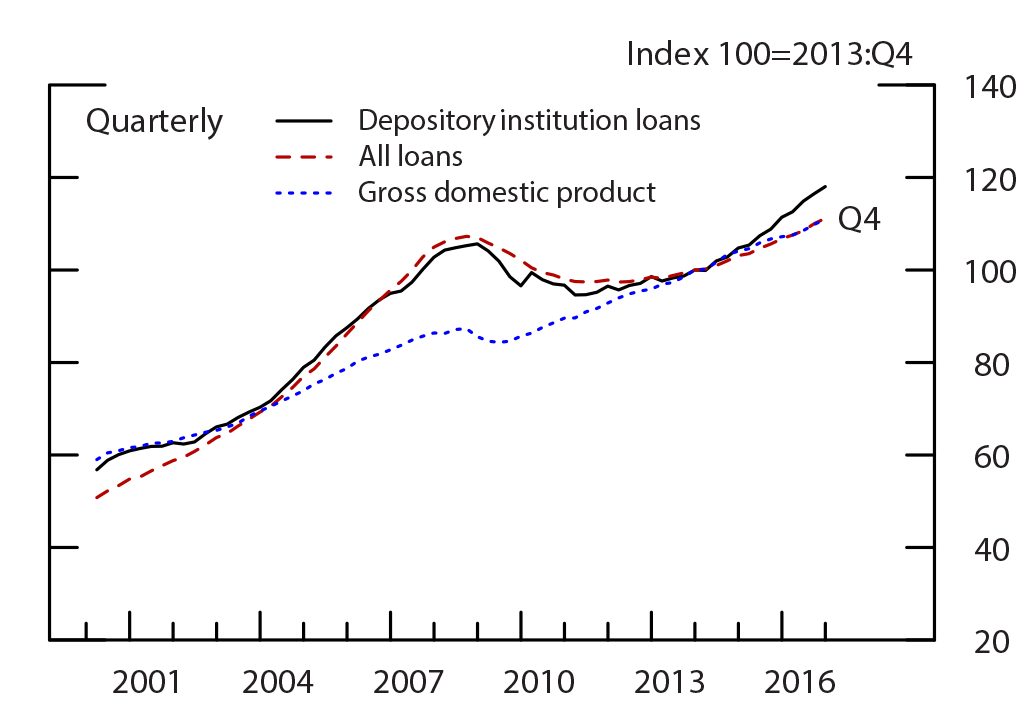
Before turning to an in-depth analysis of post-crisis trends in bank lending, it is important to understand the overall structure of credit in the U.S. economy. Figure 1 shows the path of loans and nominal GDP from 2000:Q1 to 2016:Q4.5 Loans provided by depository institutions (DI)–commercial banks, thrifts, and savings banks–are shown separately from all loans. Levels are indexed to 100 at 2013:Q4. As a result, the lines are tracking cumulative growth. DI loan growth and total loan growth (black line and dashed-red line, respectively) had generally been the same priorto and during the financial crisis. In the run-up to the crisis, overall loan growth sharply outpaced GDP growth (blue).6 This potentially large and persistent excess of credit growth reversed during the crisis. Finally, note that in the past two years, DI loan growth is greater than GDP and total loans. In fact, DI loans have surpassed levels reached during the crisis.
Table 1 shows the size of DI lending relative to total loans supporting the economy. Column (1) shows DI share of loans in 2006:Q4 just prior to the financial crisis, and column (2) shows the share in 2016:Q4. Over this time, DIs have expanded their role in nonfinancial business lending and consumer lending. The other shares are fairly similar, though residential real estate (RRE) loans have dropped a bit. In total, DIs have expanded their share of loans since 2006:Q4 with growth of 24 percent compared to total loan growth of 16 percent.
Source: Financial Accounts of the United States, Bureau of Economic Analysis.
Financial Accounts of the United States data are available here: https://www.federalreserve.gov/releases/z1/current/default.htm.
Bureau of Economic Analysis, GDP, data are available here: https://www.bea.gov/national/index.htm#gdp.
Table 1: DI Share of Loans and Total Loans
| (1) | (2) | (3) | |
|---|---|---|---|
| DI share of loans | Total level ($ in billions) | ||
| 2006:Q4 | 2016:Q4 | 2016:Q4 | |
| Nonfinancial business * | 0.54 | 0.62 | 3,577 |
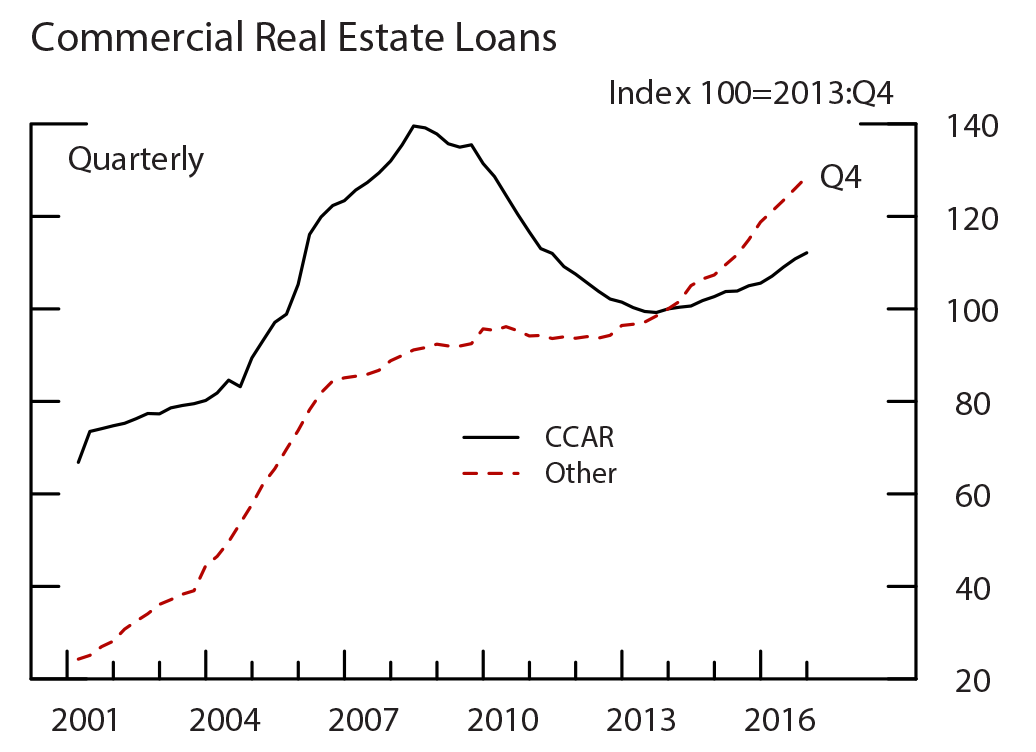
| Commercial real estate | 0.50 | 0.51 | 3,801 |
| Residential real estate | 0.28 | 0.24 | 10,266 |
| Consumer | 0.34 | 0.41 | 3,765 |
| Total | 0.36 | 0.38 | 21,409 |
Source: Financial Accounts of the United States, Consumer Credit G.19 release.
Financial Accounts of the United States data are available here: https://www.federalreserve.gov/releases/z1/current/default.htm.
Federal Reserve, G.19, data are available here: https://www.federalreserve.gov/releases/g19/current/default.htm.
Note: Loans include nonfinancial business loans (L.102), commercial mortgages (L.220), home mortgages (L.218), multifamily residential mortgages (L.219), and consumer credit (G.19 release).
* Nonfinancial business loans defined as “Depository institution loans not elsewhere classified” and “Other loans and advances” in table L.102.
Nonetheless, many stakeholders have expressed concerns that changes in regulation and supervision of banks have affected their lending. An analysis of this issue is important, as the enhanced prudential standards have focused on the largest, most systemic firms because of the fallout associated with their distress during the crisis. For example, building resiliency at the largest, most systemic banks is the main goal of the Federal Reserve’s Comprehensive Capital Analysis and Review (CCAR) and stress test exercises mandated by the Dodd–Frank Act. Some have suggested that the stringency of those stress tests and the identification of assets that are particularly sensitive to economic downturns have caused banks to change the way they allocate credit to types of borrowers, but this could be said of any potentially binding capital standard. This criticism also fails to account for one of the most important goals of stress tests, which is to determine whether a bank, and the system as a whole, has sufficient capital to continue operating and making loans to creditworthy borrowers throughout times of financial stress or a severe recession, like the recent one between 2007 and 2009, rather than pulling back from lending broadly and exacerbating the crisis.
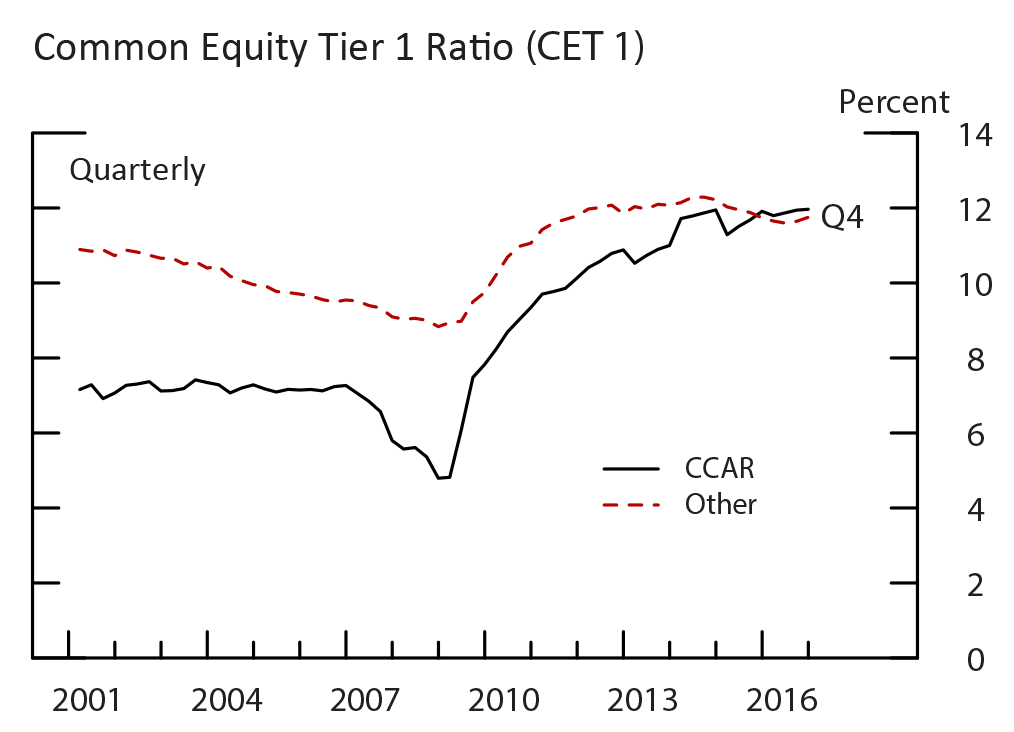
Participation in the stress tests is required for banks with consolidated assets of $50 billion or more.7 As shown in figure 2, the CCAR banks (black) generally funded their balance sheets with less capital than the other banks (red) before the crisis.8 During the crisis, this critical and stable source of funding fell further for large banks as they faced more severe losses that eroded their capital base. Since the crisis, this gap between the capital of large banks and other banks has narrowed, likely due to the strengthening in capital requirements for banks and bank holding companies implemented by the Federal Reserve, the Office of the Comptroller of the Currency (OCC), and the Federal Deposit Insurance Corporation (FDIC) following the crisis, including the legislated requirement to strengthen regulation for the largest and most systemic institutions. In particular, regulators have implemented a capital surcharge for global systemically important banks (GSIBs) and the enhanced supplementary leverage ratio (eSLR), which applies to bank holding companies with more than $700 billion in consolidated total assets or more than $10 trillion in assets under custody.9
Note: Prior to 2014:Q1, the numerator of the common equity tier 1 ratio is tier 1 common capital. Beginning in 2014:Q1 for advanced approaches BHCs and in 2015:Q1 for all other BHCs, the numerator is common equity tier 1 capital.
Source: FR Y-9C.
More information on the Federal Reserve, FR Y-9C Consolidated Financial Statement for Holding Companies, data is available here: https://www.federalreserve.gov/apps/reportforms/reportdetail.aspx?sOoYJ+5BzDal8cbqnRxZRg==.
A related motivation of post-crisis banking regulation was to even the playing field between large and small banks.10 Given perceptions of investors that some banks were “too big to fail,” post-crisis financial regulations force large banks to fund their balance sheets with more capital, hold significant liquidity buffers, and to develop resolution plans. For example, the GSIB surcharge was calibrated to measure each GSIB’s expected impact on the financial system conditional on it failing (Board 2015). These regulations therefore help eliminate any unwarranted funding cost advantage that those perceptions confer on large banks. A Government Accountability Office study (GAO 2014) generally finds evidence that the recent regulatory reforms have reduced the subsidy relative to pre-crisis estimates. In addition, both Moody’s and S&P downgraded the debt ratings of some of the largest domestic banks in 2013 and 2015, respectively, citing that they were no longer confident that the U.S. government would step in to support those banks in a future crisis. As the funding costs and capital levels of large and small banks converge, one would expect smaller banks to be more able to compete for loans and grow faster, at least for a time, than large banks.
Lending at Large and Small Banks
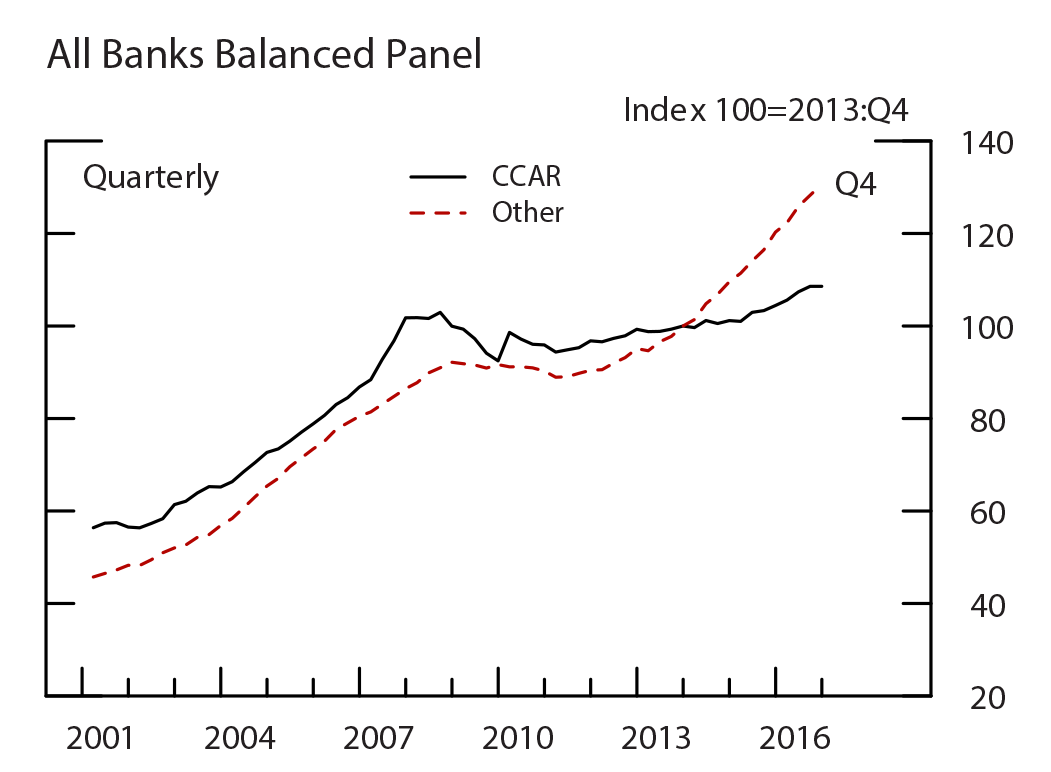
As shown in the top chart of figure 3, banks of all sizes have been growing loans since the crisis. Note that these data are again indexed, setting 2013:Q4 to 100. In addition, the growth rates used to construct these indexes have been adjusted for mergers such that organic growth is being measured. Growth through the purchase of loans in a bank merger is excluded.11 Organic loan growth is a better measure of the amount of new credit being extended in support of economic growth. While CCAR banks have been increasing loans more slowly than other banks since 2014, faster growth by smaller banks during an economic expansion is not new. The smaller banks also had faster growth between 2001 and 2006.
Source: FR Y-9C.
Source: FR Y-9C.
More information on the Federal Reserve, FR Y-9C Consolidated Financial Statement for Holding Companies, data is available here: https://www.federalreserve.gov/apps/reportforms/reportdetail.aspx?sOoYJ+5BzDal8cbqnRxZRg==.
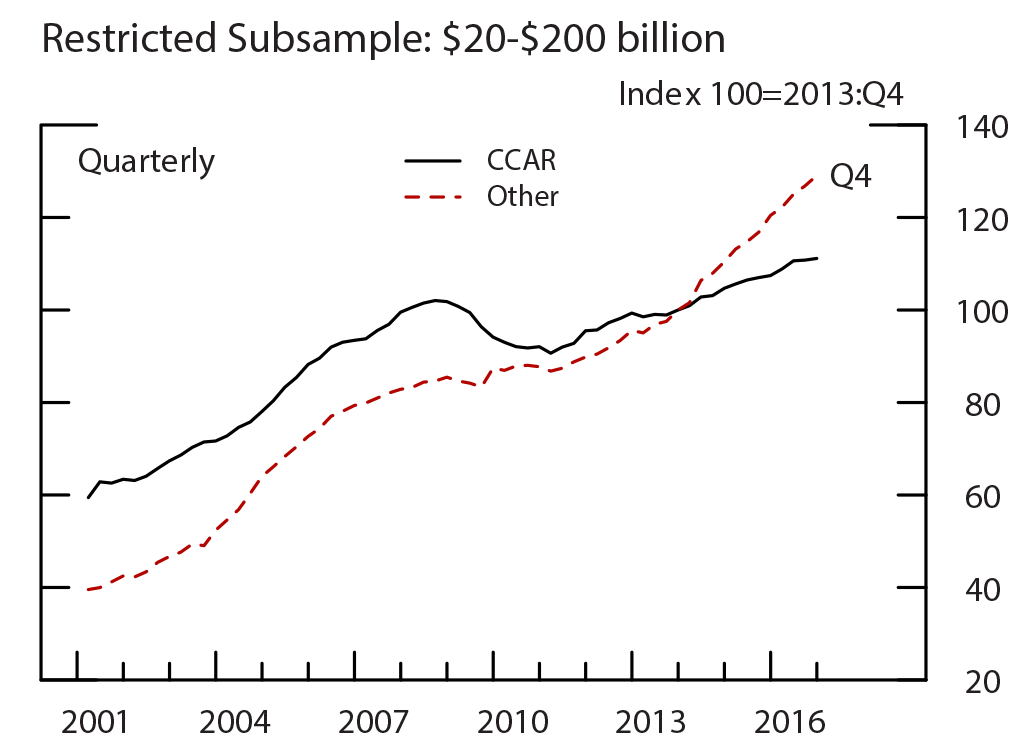
The bottom chart in figure 3 restricts the balanced panel to banks between $20 billion and $200 billion in consolidated assets.12 This creates a group of banks that are more similar and are around the $50 billion size threshold for being subject to supervisory stress tests. Banks above $50 billion are also subject to new post-crisis liquidity regulations, such as the liquidity coverage ratio (LCR). Within this subsample especially, smaller banks have much faster growth than CCAR banks, not only since the financial crisis, but dating back to at least 2001. Also note that the restricted subsample clearly indicates that the noncomplex CCAR banks experienced larger loan declines than the smaller banks around the crisis.
Loan Growth by Loan Type with Related Drivers
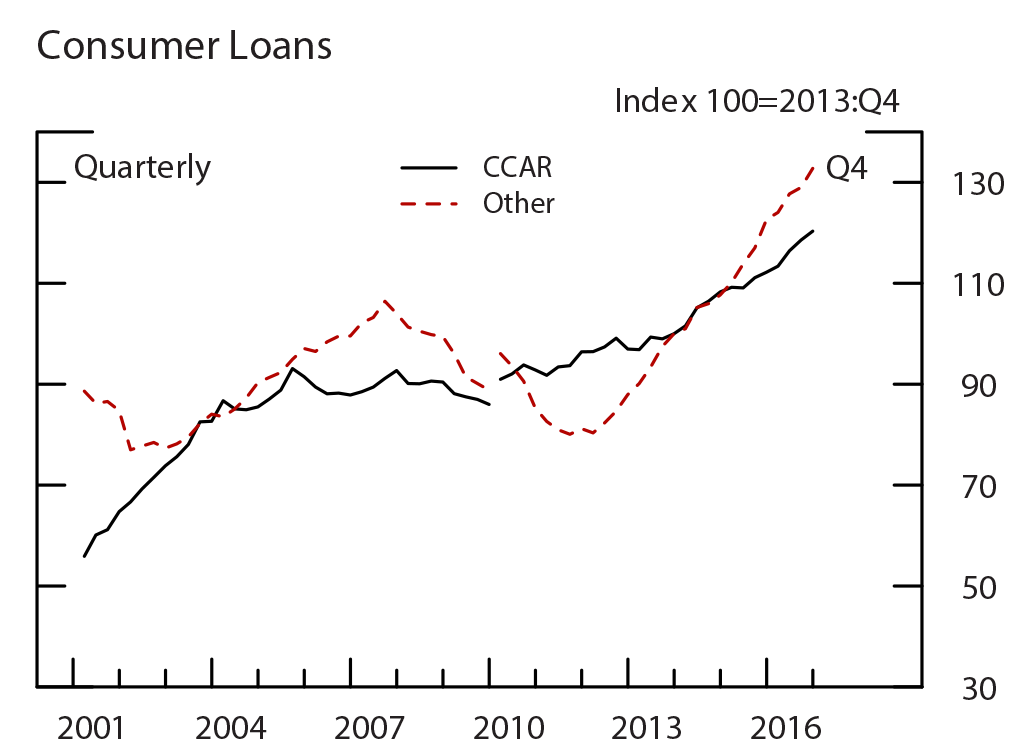
Diving deeper into the loan portfolio, we will now look at four main loan categories: commercial and industrial (C&I) loans, commercial real estate (CRE) loans, residential real estate (RRE) loans, and consumer loans (composed primarily of credit card and auto loans). Figure 4 shows these loans for the same larger balanced panel used in the top chart of figure 3.13 Consistent with figure 3, smaller banks are growing loans more quickly than CCAR banks in three of the four main loan categories. The C&I loan category is the one exception (figure 4, top panel).
Within C&I lending is small business lending, a type of loan that is of special interest because such businesses have limited opportunities to obtain financing outside of banks. Lending patterns to small businesses are similar to overall C&I lending. Figure 5 shows growth of C&I loans with original amounts of $1 million or less. Growth of small C&I loans at CCAR banks and small banks has been similar over the past five years.14 Yet, CCAR banks provided 2 times the amount of such loans in 2016.
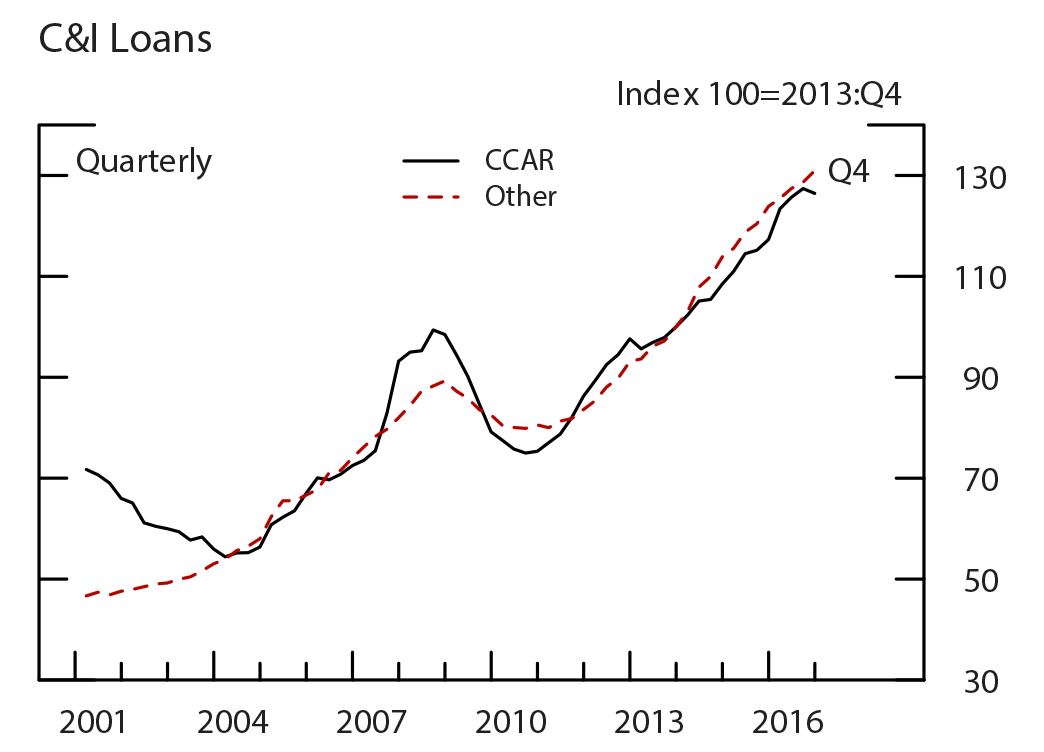
Source: FR Y-9C.
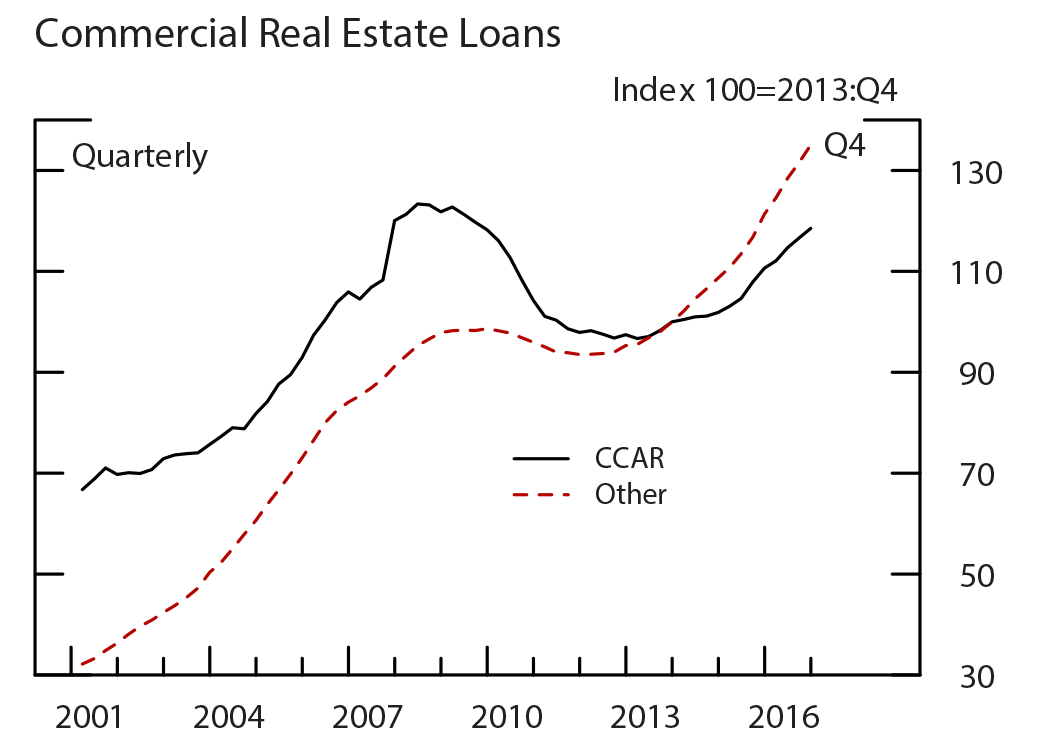
Source: FR Y-9C.
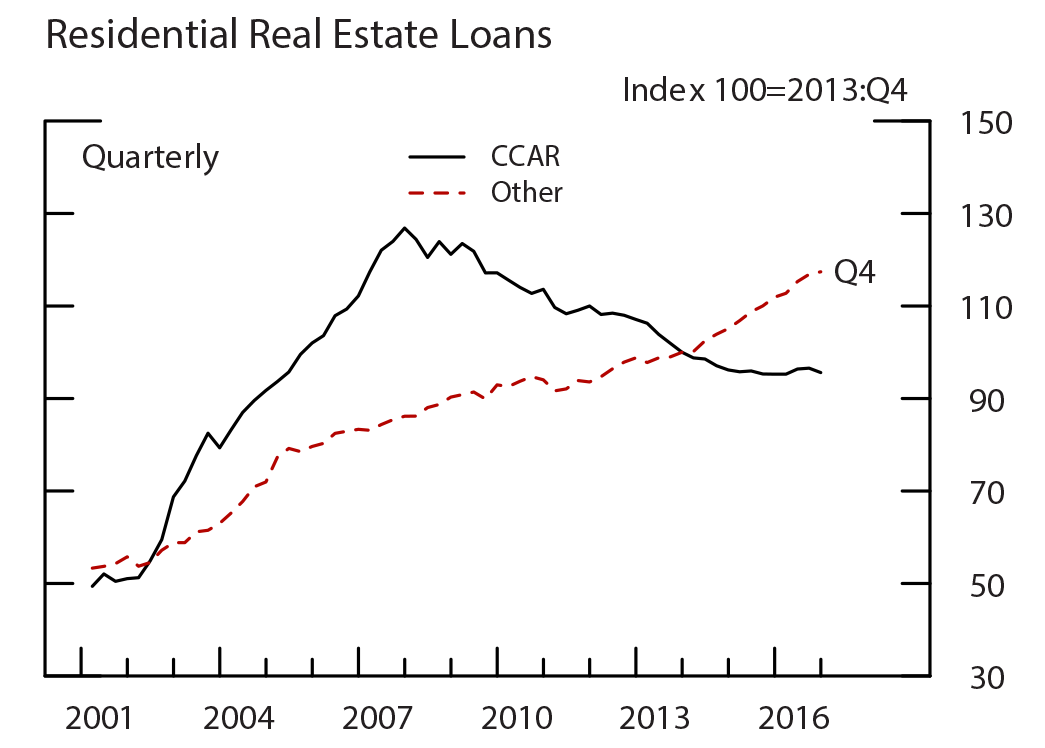
Source: FR Y-9C.
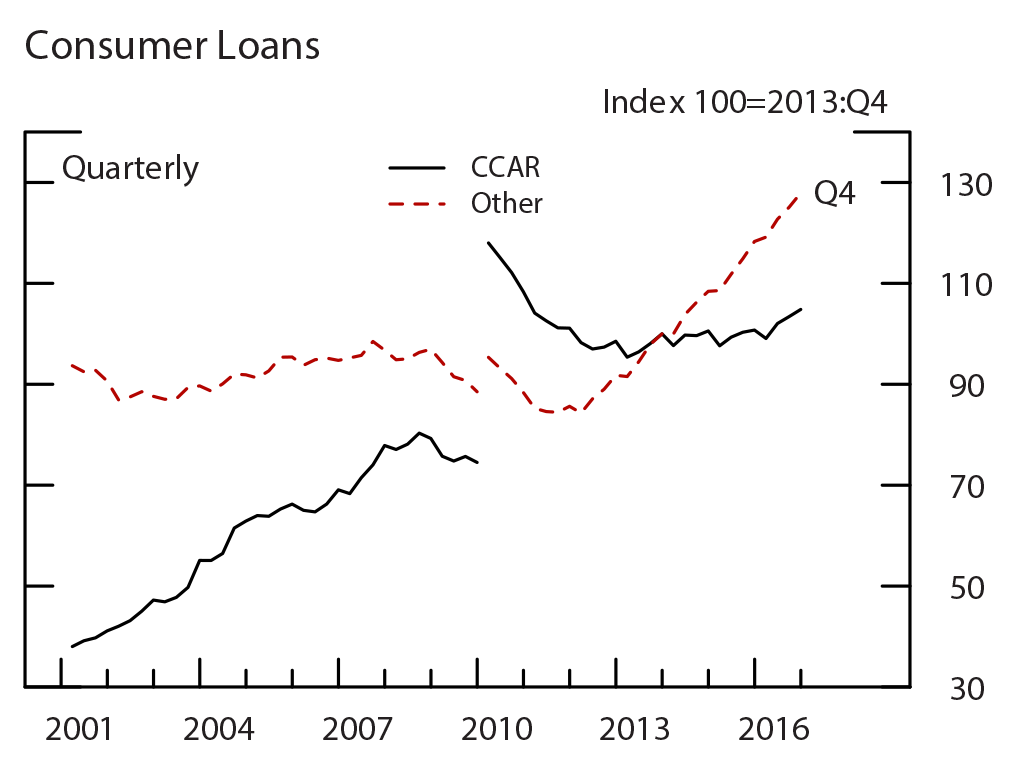
Note: The break in the consumer loans series is due to FAS 167.
Source: FR Y-9C.
More information on the Federal Reserve, FR Y-9C Consolidated Financial Statement for Holding Companies, data is available here: https://www.federalreserve.gov/apps/reportforms/reportdetail.aspx?sOoYJ+5BzDal8cbqnRxZRg==.
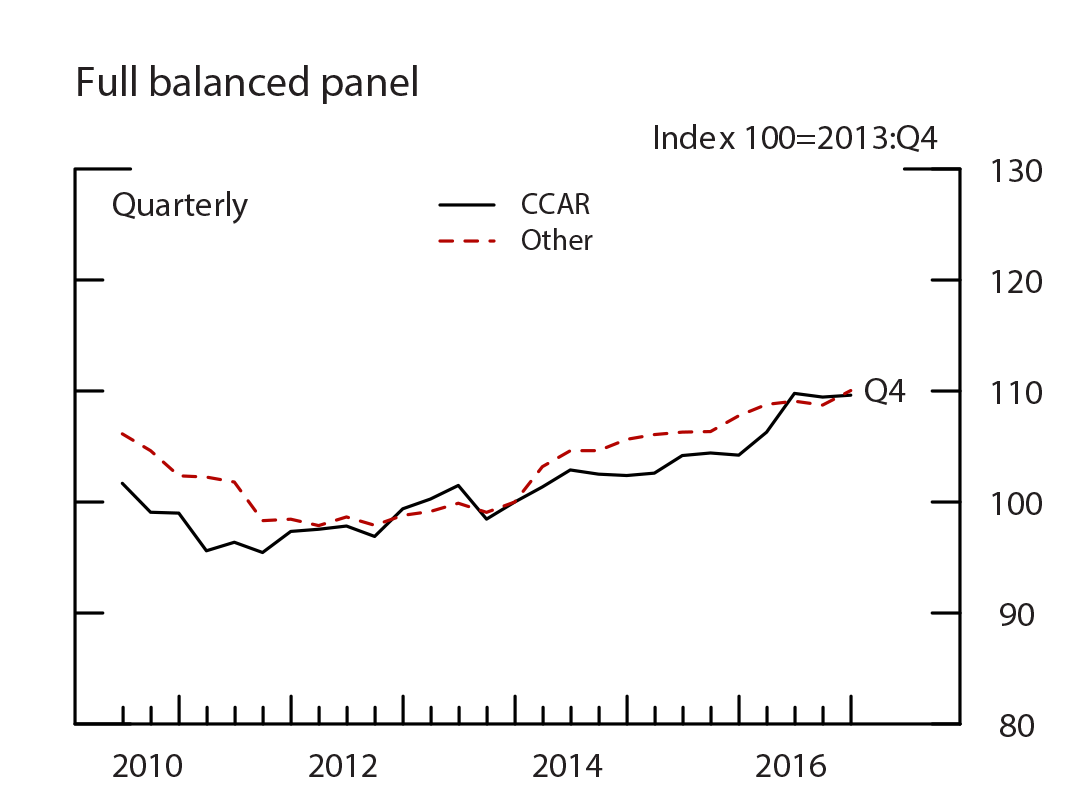
Note: Small business loans are loans with an original amount of $1 million or less.
Source: Call Report.
More information on FFIEC, Call Reports, data is available here: https://cdr.ffiec.gov/public/.
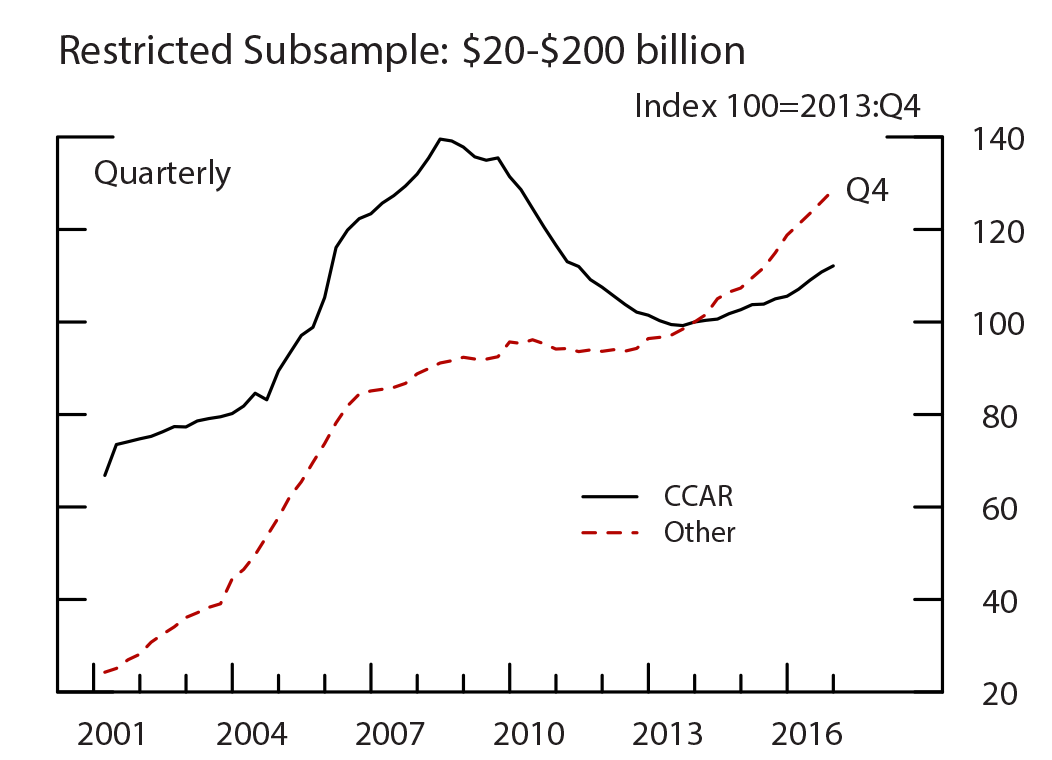
As shown in figure 4 (second panel), CRE lending has been consistently weaker at CCAR banks than small banks, showing slower growth before the crisis and in the past five years. In addition, the largest declines during the crisis occurred at the CCAR banks, suggesting larger loan write-downs, perhaps due to weaker underwriting. Figure 6 shows CRE loan growth for the restricted subsample. As in the all banks balanced panel, large banks had less growth than small banks throughout the time period, not just in the post-crisis environment. The consistently stronger growth at smaller banks may be because they have comparative advantages over large banks in CRE lending (Bassett and Brady (2001) and Keeton et al. (2003)).
Source: FR Y-9C.
More information on the Federal Reserve, FR Y-9C Consolidated Financial Statement for Holding Companies, data is available here: https://www.federalreserve.gov/apps/reportforms/reportdetail.aspx?sOoYJ+5BzDal8cbqnRxZRg==.
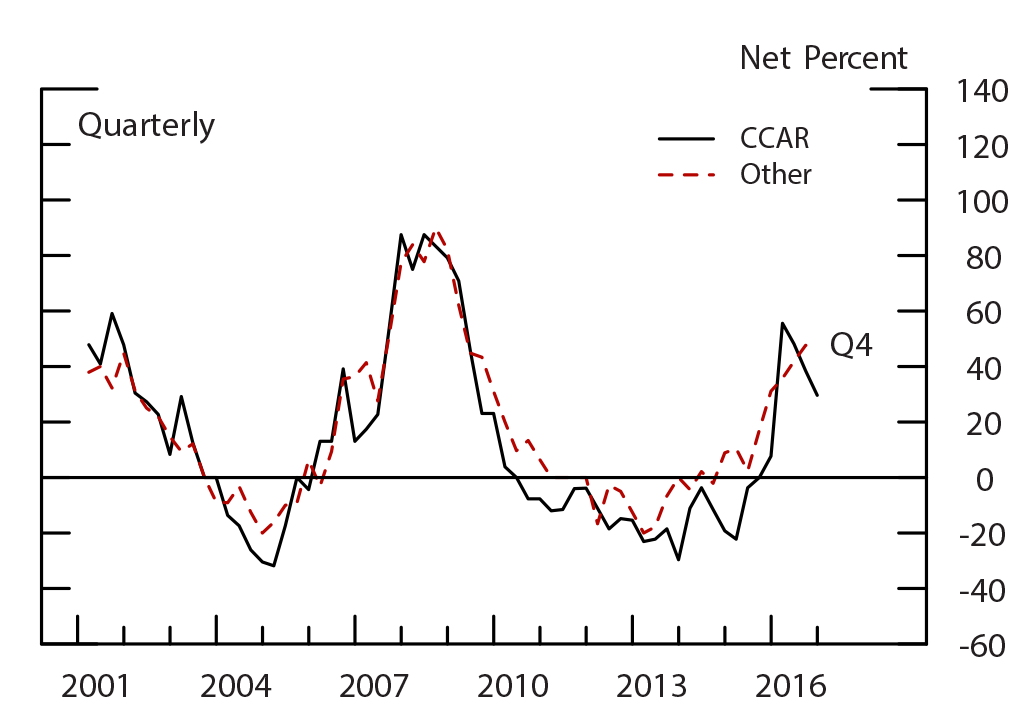
Though loan growth has been slower at CCAR banks, banks in that group have been reporting an easing of lending standards on CRE loans. As shown in figure 7, according to the Senior Loan Officer Opinion Survey (SLOOS), larger net fractions of CCAR banks consistently reported having eased standards between 2010 and 2015 than those of smaller banks in the survey. This pattern suggests that CCAR banks have been competing aggressively for new CRE loans, an action that would be inconsistent with banks that were constraining CRE lending as a result of capital requirements or other financial regulation.
Source: SLOOS.
More information on the Federal Reserve, Senior Loan Officer Opinion Survey, data is available here: https://www.federalreserve.gov/data/sloos/sloos.htm.
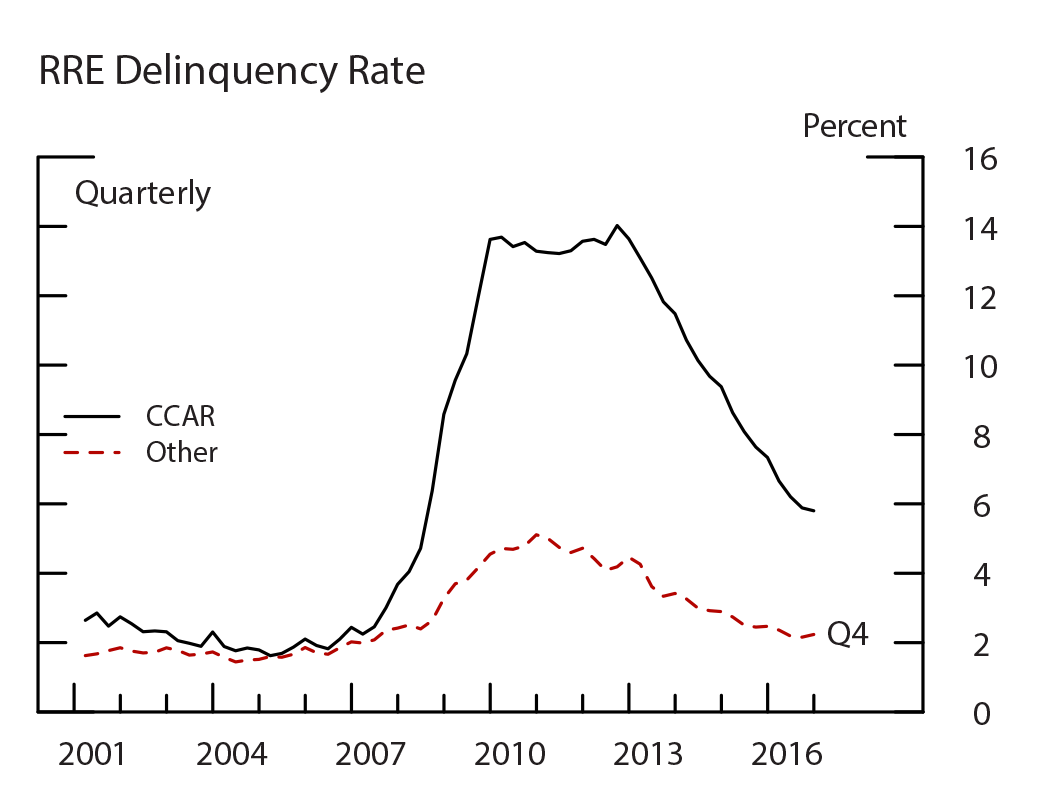
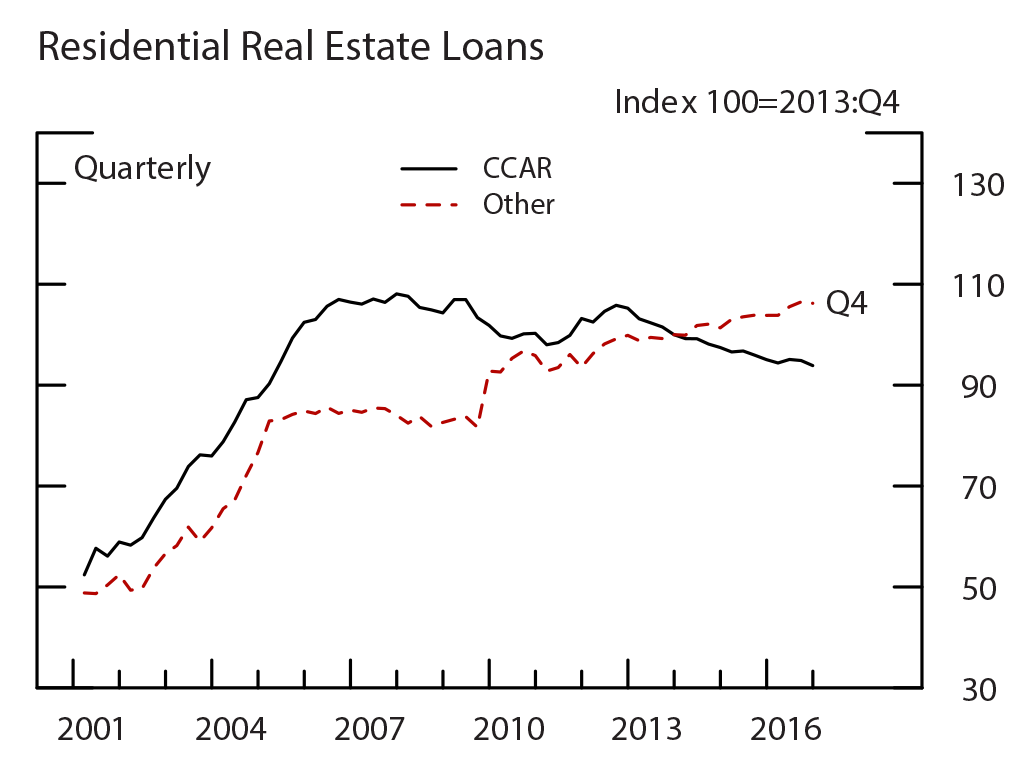
The final loan type that this note will highlight is residential real estate loans. As shown in figure 4 (third panel), RRE loans at CCAR banks in the balanced panel rose precipitously prior to the crisis, dropped steadily through 2014, and has leveled off in recent years. The largest banks’ current appetite for RRE loans is likely affected by those crisis lending experiences–excessively easy credit standards led to painful losses when assumptions about house prices proved faulty and exposed weaknesses in underwriting and other risk management practices. Indeed, delinquency rates are still elevated at the CCAR banks, as shown in the top panel of figure 8. In addition, between 2009 and 2012, CCAR banks had to repurchase $82 billion RRE loans. These repurchases were primarily due to breaches of representations and warranties associated with securitizations. From the perspective of loan portfolio management, high delinquencies and forced repurchases of loans for which risks were thought to have been transferred should result in more-cautious lending policies, even in the absence of changes in supervision and regulation.
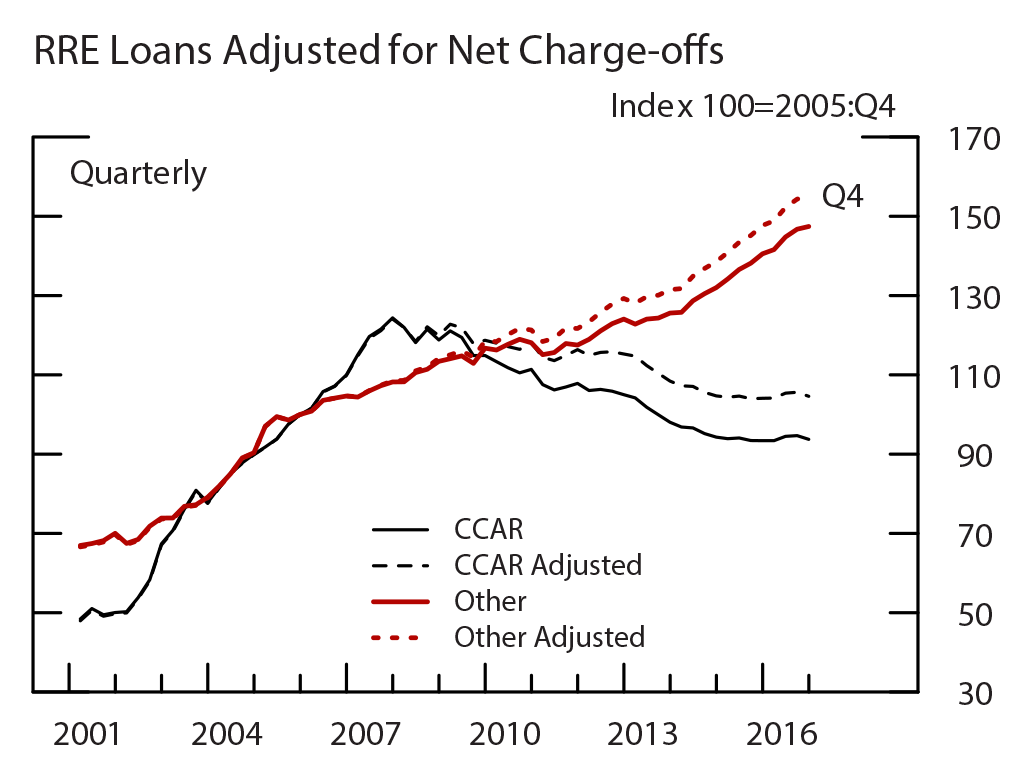
The bottom panel of figure 8 shows RRE loan growth adjusting for charge-offs. The reason for this adjustment is that it gets closer to a measure of new loan originations, which are more closely related to economic activity than the stock of on-balance-sheet loans.15 For this calculation, loans written-off by a bank as uncollectable are added back to the balance sheet for the growth calculation. Notice that the index is also reset to 2005:Q4 to make it easier to see the differing experience around the crisis by bank group. Using this adjusted measure, RRE lending at CCAR banks did not decrease as much during and following the crisis and has been about flat over the past three years. In contrast, RRE loan growth and adjusted loan growth for small banks are relatively closer. The differences in charge-off rates on legacy real estate portfolios add to the evidence that RRE underwriting of CCAR banks was less strict than that of smaller banks prior to the crisis.
Source: FR Y-9C.
Source: FR Y-9C.
More information on the Federal Reserve, FR Y-9C Consolidated Financial Statement for Holding Companies, data is available here: https://www.federalreserve.gov/apps/reportforms/reportdetail.aspx?sOoYJ+5BzDal8cbqnRxZRg==.
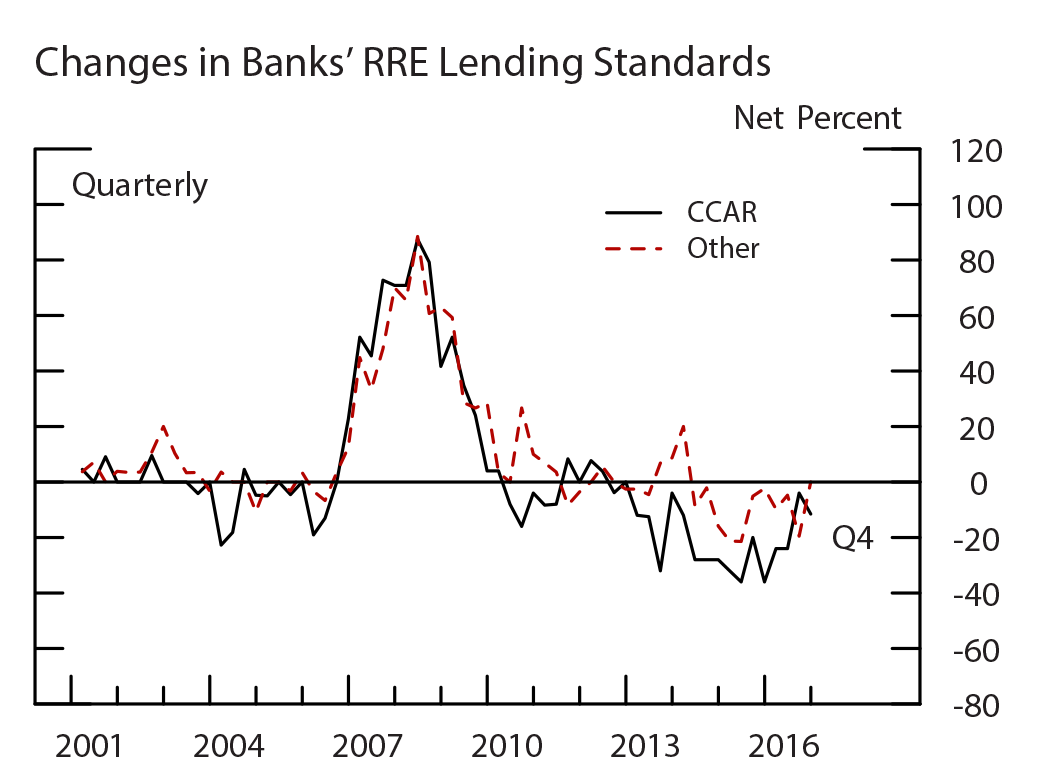
The lessons learned from absorbing the costs of that loose underwriting might be expected to have caused the large banks to tighten standards more than small banks during the financial crisis and remain tighter than smaller banks in its immediate aftermath. However, as shown in the top chart of figure 9, similar net fractions of CCAR banks and small banks reported tightening standards in 2008 and 2009. Since then, the pattern changed. A higher net fraction of CCAR banks have reported easing standards between 2010 and 2015 than small banks. The most recent reading of the levels of standards, from the July 2016 SLOOS, allow us to gauge the net effect of the tightening and easing cycle from 2005 to 2016.16 In that survey, 40 percent of CCAR banks reported that standards for RRE loans were about in line with their longer run averages. The same was true for about 60 percent of the other banks.
It is also likely that other regulatory changes such as the capital costs of mortgage servicing and consumer protection rules are affecting banks’ ability and willingness to make mortgage loans to certain borrowers. Generally, these regulatory changes encourage more sustainable lending practices and prevent the excesses of the mid-2000s. Moreover, even if these regulations are curbing credit availability from large banks more so than from small banks, banks as a group hold only a small percentage of overall mortgage debt in the form of mortgage loans. As shown in table 1, DIs provide 24 percent of that funding in the form of whole mortgages held on their balance sheets.
Source: SLOOS.
Source: FR Y-9C.
More information on the Federal Reserve, Senior Loan Officer Opinion Survey, data is available here: https://www.federalreserve.gov/data/sloos/sloos.htm.
More information on the Federal Reserve, FR Y-9C Consolidated Financial Statement for Holding Companies, data is available here: https://www.federalreserve.gov/apps/reportforms/reportdetail.aspx?sOoYJ+5BzDal8cbqnRxZRg==.
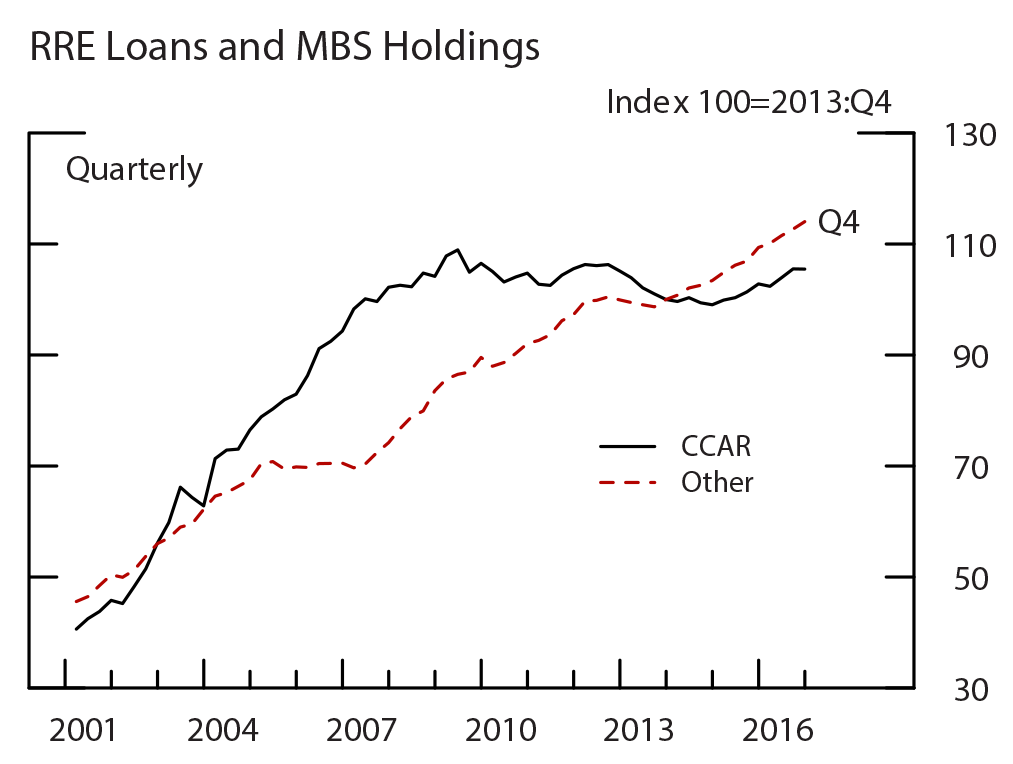
That said, banks play an important role in originating loans that are ultimately funded by insurance companies or by investors holding mortgage-backed securities (MBS). Additionally, banks themselves hold a large amount of MBS, and bank holdings of both whole mortgages in their loan portfolio and MBS in their securities portfolio support the extension of mortgage credit to households. The bottom chart of figure 9 shows this more complete measure of mortgage credit support from banks. Under this new measure, CCAR banks have been increasing mortgage credit during the past two years.
Conclusion
Loan growth at CCAR banks has been slower than at small banks in the past three years. This difference in loan growth is likely impacted by the different challenges banks faced during and following the crisis. Namely, CCAR banks are subject to more regulation but were also more financially vulnerable coming out of the crisis: CCAR banks had less capital available to fund loans, higher losses due to defaulted loans, and large legal costs resulting from their actions leading up to the crisis. In the case of RRE loans, CCAR banks had much larger charge-offs and continue to have higher delinquency rates than smaller banks. Nonetheless, CCAR banks have been increasing their holdings of MBS, which also contributes importantly to credit supply in this market.
In terms of the overall health of the banking industry and the economy, the extension of bank credit has been growing faster than nominal GDP in recent years. Loans from all providers of credit have also been growing. In addition, regulatory programs such as stress testing help ensure that lending practices are sustainable and that lending capacity will not be disproportionately withdrawn in tough times. Such withdrawals of bank credit contributed materially to the recent recession and other credit crunches.
References
Bassett, William F. and Thomas F. Brady. 2001. Board of Governors, “The Economic Performance of Small Banks, 1985-2000.” Federal Reserve Bulletin, November, pp. 719-728.
Bassett, William F. and Marcelo Rezende. 2015 “Relation between Levels and Changes in Lending Standards Reported by Banks in the Senior Loan Officer Opinion Survey on Bank Lending Practices,” FEDS Note, January 16, https://www.federalreserve.gov/econresdata/notes/feds-notes/2015/relation-between-levels-and-changes-in-lending-standards-reported-by-banks-in-the-senior-loan-officer-opinion-survey-on-bank-lending-practice-20150116.html.
Board of Governors of the Federal Reserve System (Board). 2015. Calibrating the GSIB Surcharge, July 20, www.federalreserve.gov/aboutthefed/boardmeetings/gsib-methodology-paper-20150720.pdf.
Drehmann, Mathias, Claudio Borio, and Kostas Tsatsaronis. 2011. “Anchoring Countercyclical Capital Buffers: The Role of Credit Aggregates,” International Journal of Central Banking, December, pp. 189-240.
Government Accountability Office (GAO). 2014. Large Bank Holding Companies: Expectations of Government Support, July, GAO-14-621, www.gao.gov/assets/670/665162.pdf.
Keeton, William, Jim Harvey, Paul Willis, George A. Kahn, Linda Schroeder, and Stuart Weiner. 2003. “The Role of Community Banks in the U.S. Economy.” Federal Reserve Bank of Kansas City, Economic Review, Second Quarter, pp. 15-43.
Tarullo, Daniel K. (2011), “The Evolution of Capital Regulation,” speech delivered at The Clearing House Business Meeting and Conference, New York, NY, November 9, https://www.federalreserve.gov/newsevents/speech/tarullo20111109a.htm.
Appendix
Source: FR Y-9C.
Source: FR Y-9C.
Source: FR Y-9C.
Note: The break in the consumer loans series is due to FAS 167.
Source: FR Y-9C.
More information on the Federal Reserve, FR Y-9C Consolidated Financial Statement for Holding Companies, data is available here: https://www.federalreserve.gov/apps/reportforms/reportdetail.aspx?sOoYJ+5BzDal8cbqnRxZRg==.
1. I thank William Bassett, Jose Berrospide, Michael Kiley, and Andreas Lehnert for comments. I also thank Femi Ogunrinu and Daniel Schwindt for excellent research assistance. Return to text
2. The data used in this note come from the Consolidated Financial Statements for Holding Companies–FR Y-9C–a quarterly form. To make the data comparable over time, a balanced panel of banks is created between 2000:Q4 and 2016:Q4. International banks that had to form intermediate holding companies were dropped. These institutions had to significantly change their reporting beginning in 2016:Q3. The resulting panel contains 372 banks, including 17 large banks subject to stress testing. Return to text
3. Loan originations, new loans, more accurately measure the availability of new credit. However, those data are not collected for all banks due to reporting burden. This note uses on-balance sheet loan growth which captures the growth in the total amount of loan credit being extended by banks to support economic activity. Return to text
4. Bank credit is based on the Federal Reserve’s weekly measure published in the H.8 release. H.8 data are benchmarked to the Call Reports and provide an estimate of an aggregate balance sheet for domestic commercial banks. More information on the release is available on the Federal Reserve Board website https://www.federalreserve.gov/releases/h8/current/default.htm. Nominal GDP is published by the Bureau of Economic Analysis https://www.bea.gov/. Return to text
5. Another important source of credit not included in this figure is debt securities, including corporate bonds and commercial paper. Firms that can use debt securities markets for funding are generally less reliant on banks for funding. Corporate and foreign bonds totaled $12 trillion as of 2016:Q4. Return to text
6. The gap between the ratio of credit to GDP and its historical trend has been shown to capture the build-up of financial system vulnerabilities (Drehmann et al. 2011). Return to text
7. More information on the stress testing process can be found on the Federal Reserve Board website https://www.federalreserve.gov/bankinforeg/stress-tests-capital-planning.htm. Beginning with the 2017 CCAR cycle, large and noncomplex firms are no longer subject to the qualitative assessment portion of the exercise. Large and noncomplex firms are generally holding companies with total consolidated assets between $50 billion and $250 billion. See the related Federal Reserve Board press release for more details https://www.federalreserve.gov/newsevents/press/bcreg/20170130a.htm. Return to text
8. The CCAR banks consist of the banks that have undergone each of the stress tests since 2014. After creating the balanced panel, there are 17 CCAR banks: Bank of America, BB&T, Citigroup, Comerica, Fifth Third, Huntington, JPMorgan, KeyCorp, M&T Bank, Northern Trust, PNC, State Street, SunTrust, US Bancorp, Wells Fargo, and Zions. The IHCs excluded include Bank of Montreal, BBVA, HSBC, MUFG, Santander, and Toronto Dominion. The other banks that have undergone stress tests since 2014 are Ally, American Express, Capital One, Citizens Financial, Discover, Goldman Sachs, Morgan Stanley, and Regions Financial. Return to text
9. Their insured depository institution subsidiaries are also subject to the eSLR. Return to text
10. For example, see Tarullo (2011). Return to text
11. The data are adjusted for full bank or thrift mergers. Given that a FR Y-9C form is needed for the adjustment, the adjustments do not account for loan portfolio acquisitions. As a result, such portfolio acquisitions are included in “organic loan growth.” Return to text
12. This restricts the panel to a total of 31 banks, of which 10 are CCAR banks. Return to text
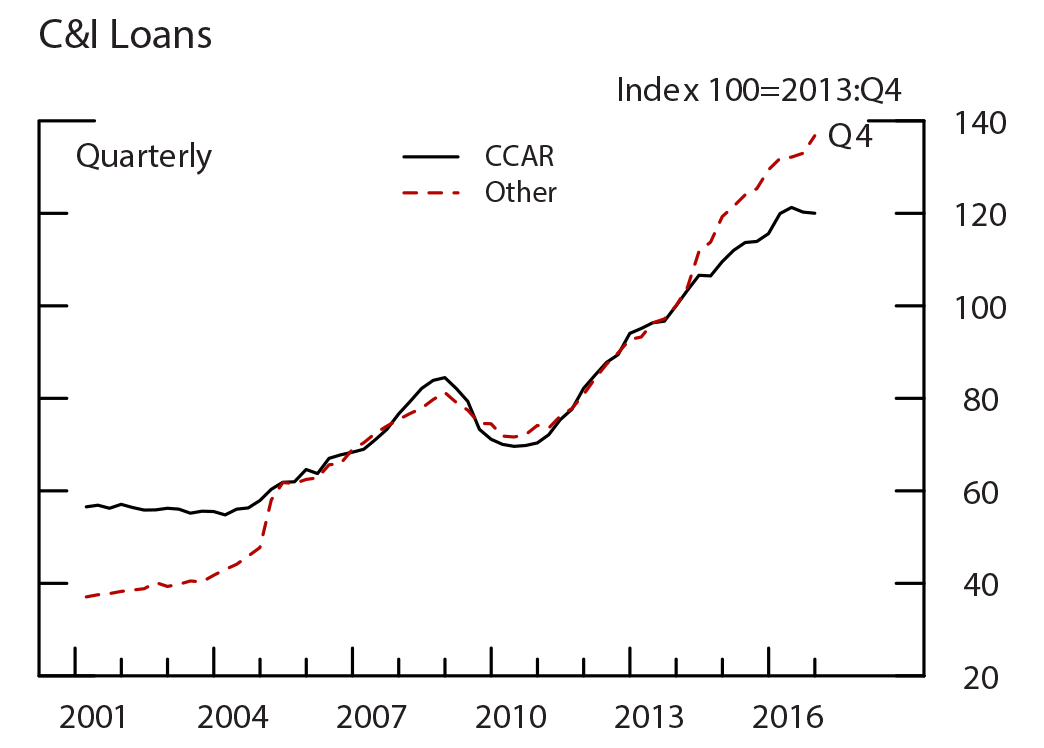
13. General patterns of recent growth look roughly the same using the restricted subsample, with the exception of C&I loans. Appendix figure A.1 shows the same graphs as figure 3 but using the restricted subsample. Return to text
14. These data are only available at a quarterly frequency beginning 2010:Q1. Return to text
15. This relationship can be seen in the formula for the change in loans (levels):
loan change = end of period (EOP) – beginning of period (BOP) = originations – paydowns – net loan sales – net charge-offs
Rewriting the formula:
EOP – BOP + net charge-offs = originations – paydowns – net loan sales Return to text
16. See Bassett and Rezende (2015) for more information on SLOOS responses about levels and changes in standards. Return to text
Disclaimer: FEDS Notes are articles in which Board economists offer their own views and present analysis on a range of topics in economics and finance. These articles are shorter and less technically oriented than FEDS Working Papers.