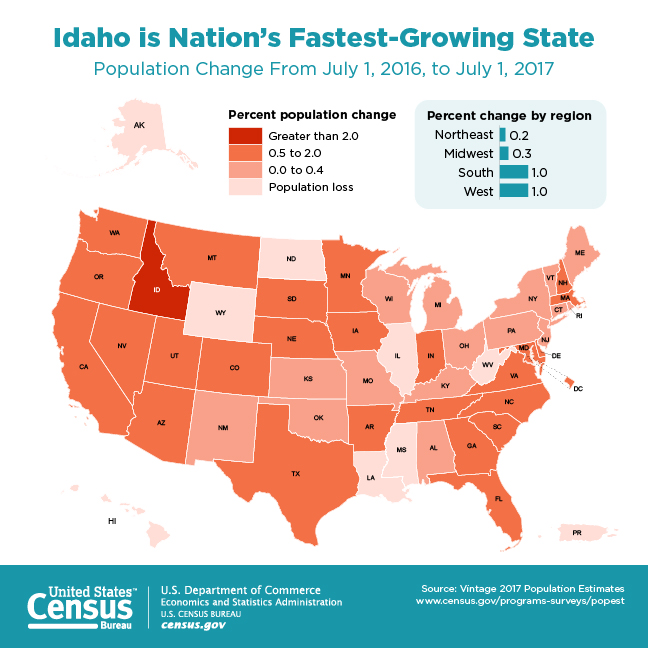
Idaho was the nation’s fastest-growing state over the last year. Its population increased 2.2 percent to 1.7 million from July 1, 2016, to July 1, 2017, according to the U.S. Census Bureau’s national and state population estimates released today.

Following Idaho for the largest percentage increases in population were: Nevada (2.0 percent), Utah (1.9 percent), Washington (1.7 percent), and Florida along with Arizona (1.6 percent).
“Domestic migration drove change in the two fastest-growing states, Idaho and Nevada, while an excess of births over deaths played a major part in the growth of the third fastest-growing state, Utah,” said Luke Rogers, Chief of the Population Estimates Branch.
The U.S. population grew by 2.3 million between July 1, 2016, and July 1, 2017, representing a 0.72 percent increase to 325.7 million. Furthermore, the population of voting-age residents (adults age 18 and over) grew to 252.1 million (77.4 percent of the 2017 total population), an increase of 0.93 percent from 2016 (249.5 million). Net international migration decreased 1.8 percent between 2016 and 2017, making it the first drop since 2012-2013. However, net international migration continues to be a significant factor in the population growth of the United States, adding just over 1.1 million people in the last year.
Eight states lost population between July 1, 2016, and July 1, 2017. Illinois had the largest numeric decline, losing 33,703 people (this was a relatively small percentage change compared to its population of 12.8 million). Wyoming had the largest percentage decline (1.0 percent). Three states that had been losing population in the previous year, Pennsylvania, Connecticut and Vermont, saw slight increases.
States in the South and West continued to lead in population growth. In 2017, 38.0 percent of the nation’s population lived in the South and 23.8 percent lived in the West.
In addition to the population estimates for the 50 states and the District of Columbia, the new estimates show that Puerto Rico had an estimated population of 3.3 million, a decline from 3.4 million in 2016.
The estimates for Puerto Rico are as of July 1, 2017, and therefore do not reflect the effects of Hurricanes Irma and Maria in September 2017. The estimates for Gulf states affected by Hurricane Harvey in August 2017 and Hurricane Irma in September 2017 are also not reflected in the July 1, 2017, estimates.
Also released today were national-and state-level estimates of the components of population change, which include tables on births, deaths and migration.
| Rank | Name | 2010 | 2016 | 2017 |
| 1 | California | 37,254,518 | 39,296,476 | 39,536,653 |
| 2 | Texas | 25,146,100 | 27,904,862 | 28,304,596 |
| 3 | Florida | 18,804,594 | 20,656,589 | 20,984,400 |
| 4 | New York | 19,378,110 | 19,836,286 | 19,849,399 |
| 5 | Pennsylvania | 12,702,857 | 12,787,085 | 12,805,537 |
| 6 | Illinois | 12,831,565 | 12,835,726 | 12,802,023 |
| 7 | Ohio | 11,536,730 | 11,622,554 | 11,658,609 |
| 8 | Georgia | 9,688,690 | 10,313,620 | 10,429,379 |
| 9 | North Carolina | 9,535,721 | 10,156,689 | 10,273,419 |
| 10 | Michigan | 9,884,129 | 9,933,445 | 9,962,311 |
| Rank | Name | 2010 | 2016 | 2017 | Numeric growth |
| 1 | Texas | 25,146,100 | 27,904,862 | 28,304,596 | 399,734 |
| 2 | Florida | 18,804,594 | 20,656,589 | 20,984,400 | 327,811 |
| 3 | California | 37,254,518 | 39,296,476 | 39,536,653 | 240,177 |
| 4 | Washington | 6,724,545 | 7,280,934 | 7,405,743 | 124,809 |
| 5 | North Carolina | 9,535,721 | 10,156,689 | 10,273,419 | 116,730 |
| 6 | Georgia | 9,688,690 | 10,313,620 | 10,429,379 | 115,759 |
| 7 | Arizona | 6,392,309 | 6,908,642 | 7,016,270 | 107,628 |
| 8 | Colorado | 5,029,325 | 5,530,105 | 5,607,154 | 77,049 |
| 9 | Tennessee | 6,346,295 | 6,649,404 | 6,715,984 | 66,580 |
| 10 | South Carolina | 4,625,381 | 4,959,822 | 5,024,369 | 64,547 |
| Rank | Name | 2010 | 2016 | 2017 | Percent growth |
| 1 | Idaho | 1,567,650 | 1,680,026 | 1,716,943 | 2.2 |
| 2 | Nevada | 2,700,691 | 2,939,254 | 2,998,039 | 2.0 |
| 3 | Utah | 2,763,889 | 3,044,321 | 3,101,833 | 1.9 |
| 4 | Washington | 6,724,545 | 7,280,934 | 7,405,743 | 1.7 |
| 5 | Florida | 18,804,594 | 20,656,589 | 20,984,400 | 1.6 |
| 6 | Arizona | 6,392,309 | 6,908,642 | 7,016,270 | 1.6 |
| 7 | Texas | 25,146,100 | 27,904,862 | 28,304,596 | 1.4 |
| 8 | District of Columbia | 601,766 | 684,336 | 693,972 | 1.4 |
| 9 | Colorado | 5,029,325 | 5,530,105 | 5,607,154 | 1.4 |
| 10 | Oregon | 3,831,072 | 4,085,989 | 4,142,776 | 1.4 |
During 2018, the Census Bureau will release estimates of the 2017 population of counties, cities and towns, and metropolitan and micropolitan statistical areas, as well as national, state and county population estimates by age, sex, race and Hispanic origin. Population estimates for Puerto Rico and its municipios by age and sex will be released as well.